This post is intended to be informative, and not so much reproducible.
Viewshed Analysis
A viewshed is an area that is visible from an observer at a given location. The problem of visibility lends itself to many domains:
- a guard on a prison tower must see the entire prison yard to ensure everyone’s safety
- a scout must maximize visibility of a battlefield for intelligence gathering
- autonomous vehicles must have 360-degree visibility
- cell-towers must provide maximum coverage
In this post, we will pay mind to the ancient world, where according to Christopherson and Guertin*, “fortified sites were often located in order to visually control their territory, sacred sites might be located to provide views of other sacred sites, and the settlement patterns of hinterland sites might be located to facilitate, or to impede, visual communication.” In particular, we will be observing and analyzing the Jordanian Umayri Wall’s Viewshed. If somebody (that is, say, 6’ tall), were standing on top of this wall, what would she see?
Umayri Wall Viewshed
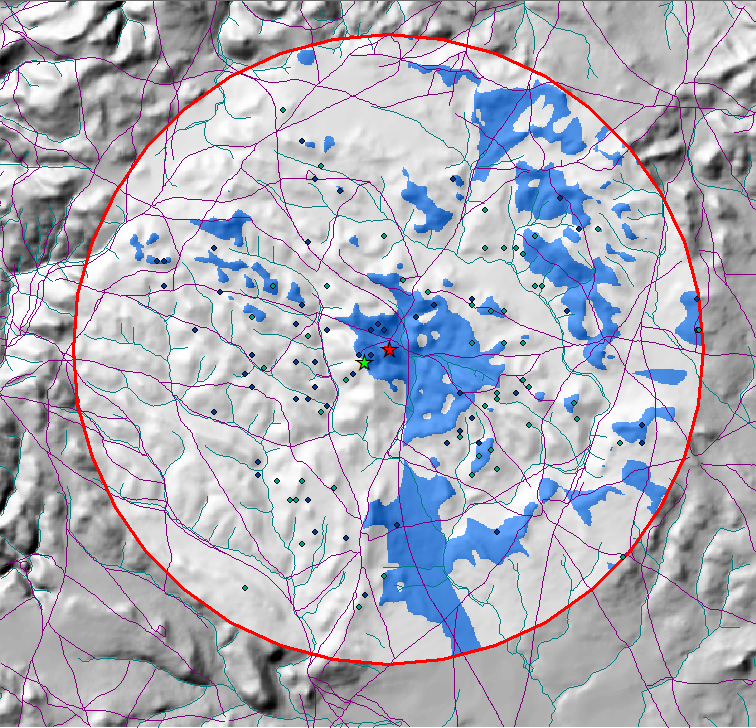
This is the Viewshed of the Tall Umayri archaeological site. The red star indicates the site, while the white space indicates area that is not visible from the site, and the blue space indicates area that is visible from the site.
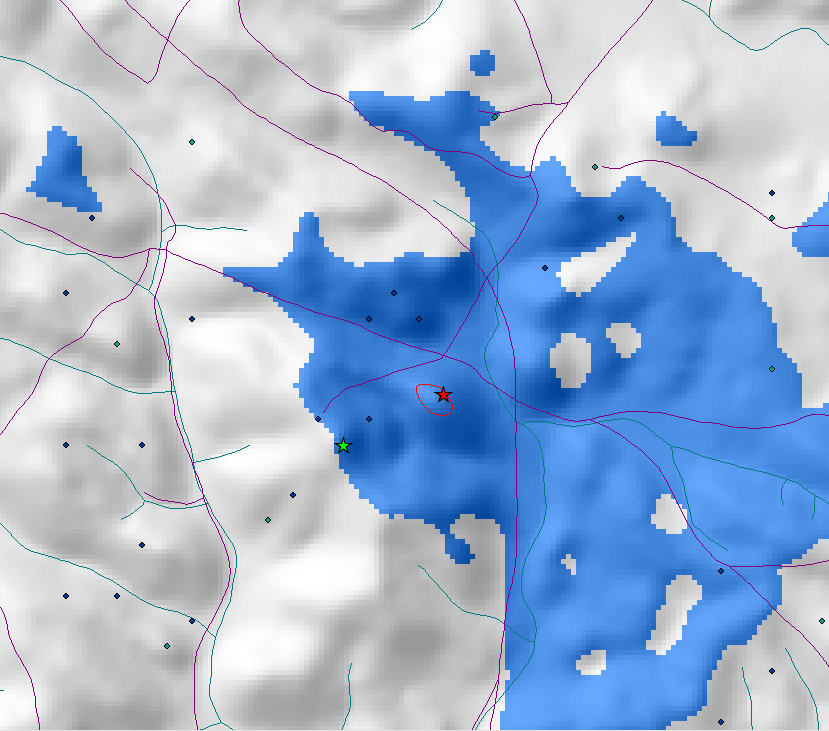
If we want to specifically see the wall, we can zoom in a little bit; the wall is indicated by the red ring. Visualizing what is visible from a given point is a powerful ability. If you noticed, this image is quite pixelated; Viewshed analyses operate on digital elevation models, which are rasters. These analyses will only work on raster data, and not vector data.
Raster Calculation
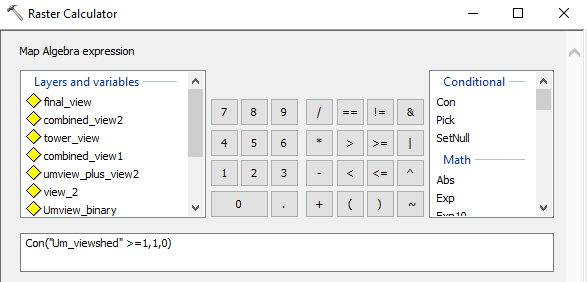
Viewsheds are rasters. GIS allows us to perform raster calculations. In ArcGIS, we can open the raster calculator and use a conditional statement (as shown below) to create a new binary raster; 0 if the cell is not ‘visible’ and falls within the boundary, and 1 if the cell is visible and within the boundary.
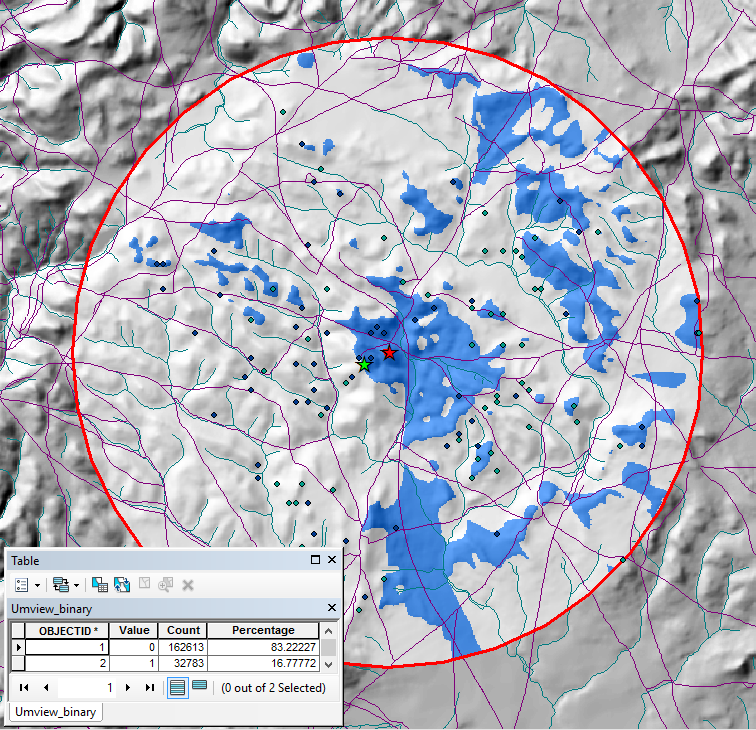
Because we have the total number of cells (not shown), and we have the number of cells that belong to both 0 (non-visibility) and 1 (visibility), we can calculate the percentages of both by non-visibility/total and visibility/total. As shown, about 17% of the cells are visible, while the remaining 83% of cells are not visible.
More Raster Calculation
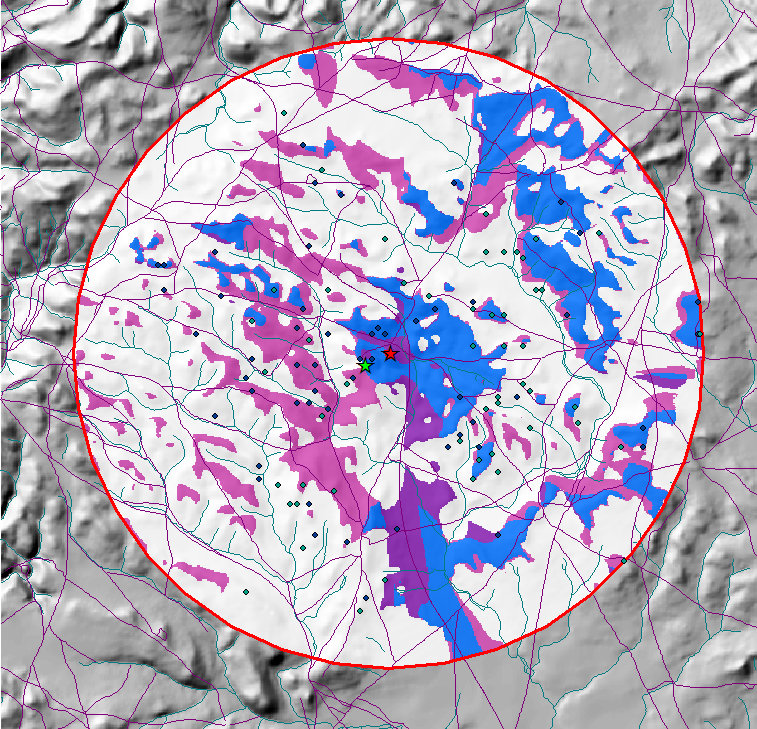
When considering viewsheds, a useful raster calculation is combining the viewshed of different points. Returned data is visualized in such a way that you can see what areas are visible from both locations, or either location. So that is what we will do, using site2 (the green star). In this example, the magenta areas can be seen from the green star, the blue from the red star, the purple from both stars, and the white from neither.
The Impact of Combined Viewsheds
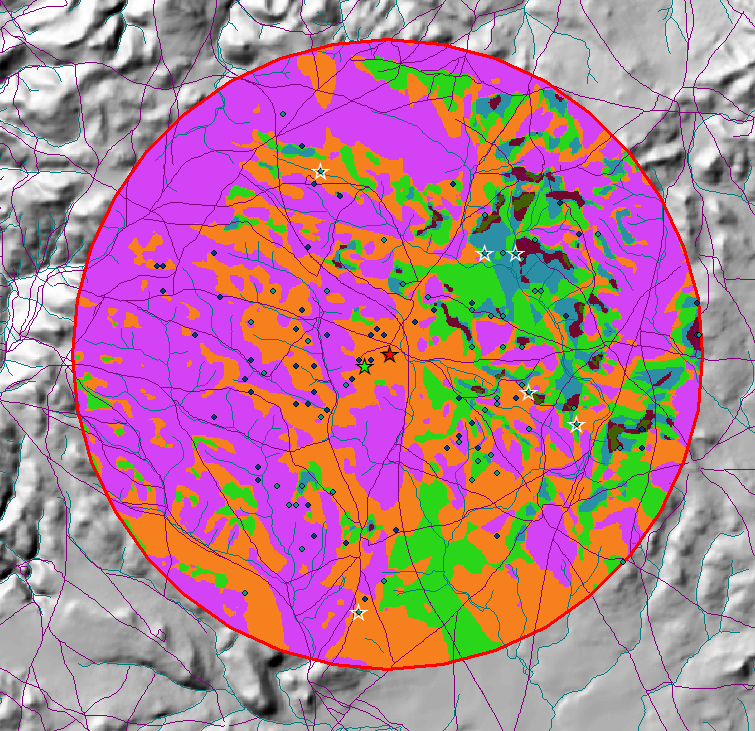
Tying back into the original application domains, to get full view of a prison yard, towers can be added (or raised). To provide full coverage to a city, cellular towers can be added. And to gain ‘full control’ over ancient sites, they too could put up more towers. So we will pretend they did, and we will see how much more visibility these added towers gave them. Our added towers will be indicated with white stars. Their respective viewsheds are indicated by the varying colors.
To get percentages of area covered, we can use the conditional statement from earlier. Remember that non-visible areas will be represented as 0’s and visible areas will be represented as 1’s. With some simple division, we can see that the new viewshed is far better, with 53% of the area being visible (as opposed to 17%), and 47% of the area not being visible (as opposed to 83%).
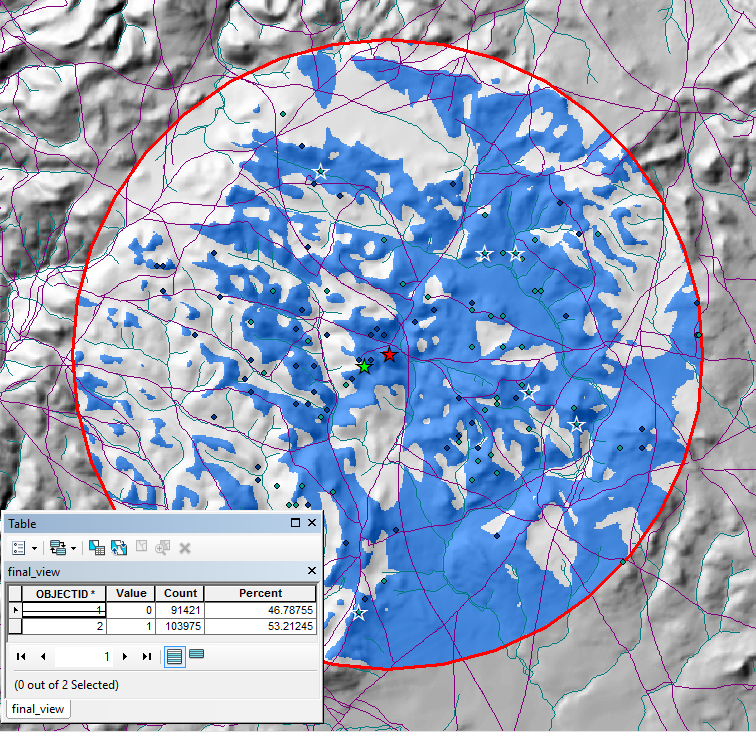
Though this is a significant improvement, it is far from ideal. The towers were added at arbitrarily chosen sites (green points). This step in the analysis could have been optimized for the best visibility, with more emphasis on western sites than eastern, or more emphasis on high-elevation points. This simple analysis can be of tremendous value to any problem concerning visibility.